
Research Brief: Housing Market November 2022
Home Sales Continue to Slide, Slowdown Stretches Across Housing Continuum
October 2022
Excerpt of Full Report:
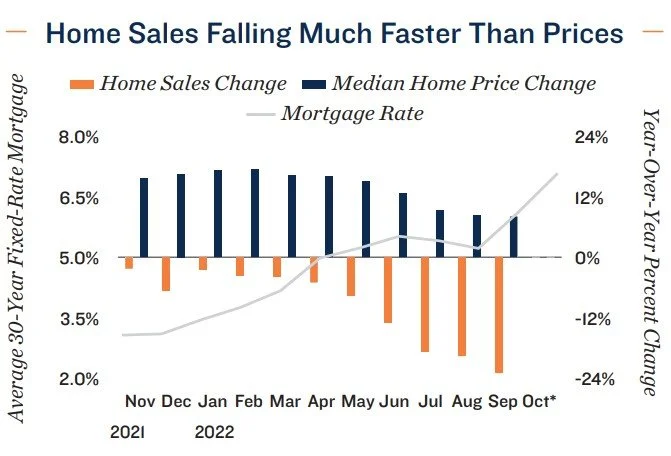
Firm price tags keep buyers on the sidelines. Purchases of single-family homes declined for an eighth straight month, marking the lowest September measure since 2012. The elevated cost of borrowing, with the average 30-year fixed-rate mortgage surpassing the Global Financial Crisis peak in late October, is the primary contributor to this ongoing cooldown. Even with the option to refinance down the road, prospective buyers are remaining passive, likely due to an emerging price expectations gap. Over the last two quarters, the median price has come down by less than 1 percent, while the volume of home purchases plummeted almost 20 percent. Buyers could be anticipating greater price drops to help off set higher borrowing costs, but that has not come to fruition. The median sales price of a single-family home rose again in September to $390,800, reversing a three-month downward trend. A significant price correction may not be on the horizon, given the still-low number of home listings by historic standards
In alignment with single-family, apartment demand recedes. Higher debt service costs are not the only force behind slower housing demand. The multifamily sector is also undergoing a decline in leasing activity as the economy wanes, household formation contracts, and young adults face hurdles starting their careers and moving out on their own. Since reaching a bottom in the fi rst quarter, Class A, B and C vacancy rates have all risen by at least 140 basis points. Additionally in September, the average number of leads per unit fell to the lowest measure in about fi ve years, signaling the demand slowdown will likely persist. By the end of 2022 the national vacancy rate is expected to climb into the mid-4 percent range, which is on par with the 2018/2019 average
Select group of markets have been more resilient. While national apartment vacancy increased 170 basis points since March, some metros posted availability drops during that span. This list includes a handful of tertiary markets in Texas, such as Midland-Odessa, Lubbock, Waco and Bryan-College Station. Many of these locations have universities and appeal to residents relocating within the region to lower their costs of living.
Developing Trends
Number of new homes for sale remains near record heights. In September, the supply of new home listings at the current sales rate held north of eight months, an elevated threshold met in every period going back to April. For context, the long-term average spanning to the 1960s is about six months’ worth of supply. The incentive for owners to move up the quality stack and purchase these newly-built dwellings is severely diminished in the current two-decade-high mortgage rate climate. This inactivity is putting a lid on the number of starter homes that come to the market, making it challenging for prospective fi rst-time buyers to fi nd options in their budget range, while also buttressing values.
Existing home listings shrink again, despite reduced buying. It is generally expected that slower purchase activity results in more homes staying on the market, but this has not been the case so far this cycle. The number of existing homes for sale fell for a second straight month in September. A lack of owners trading up, a general response to broad-based economic uncertainty and the potential for stalled career advancement are the primary causes.

Denver Office:
Adam Lewis Vice President, Regional Manager
Tel: (303) 328-2000 | adam.lewis@marcusmillichap.com
Prepared and Edited By:
Benjamin Kunde Research Analyst | Research Services
For Information on national multifamily trends, contact:
John Chang Senior Vice President, National Director | Research Services
Tel: (602) 707-9700 | john.chang@marcusmillichap.com
The information contained in this report was obtained from sources deemed to be reliable. Every effort was made to obtain accurate and complete information; however, no representation, warranty or guarantee, express or implied, may be made as to the accuracy or reliability of the information contained herein. Note: Metro-level employment growth is calculated based on the last month of the quarter/year. Sales data includes transactions sold for $1 million or greater unless otherwise noted. This is not intended to be a forecast of future events and this is not a guaranty regarding a future event. This is not intended to provide specific investment advice and should not be considered as investment advice. Sources: Marcus & Millichap Research Services; Bureau of Labor Statistics; CoStar Group, Inc.; Real Capital Analytics; RealPage, Inc. © Marcus & Millichap 2021 | www.MarcusMillichap.com