
Research Brief: Inflation June 2023
Inflation Halves Peak Rate, Giving Fed Room to Maneuver in Future Meetings
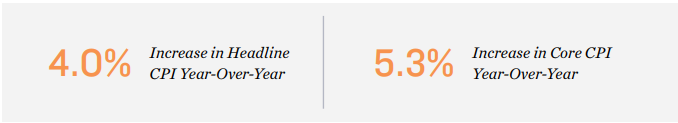
Inflation slows to 27-month low. The headline consumer price index rose by 4.0 percent year-over-year in May, less than half the 9.1 percent pace recorded last June. While consumer prices are still rising more rapidly than the Federal Reserve prefers, the cool down from peak levels encouraged officials to hold the federal funds rate flat in June. The hiatus allows more time for the Federal Open Market Committee to assess how the past 15 months of tightening monetary policy has affected the economy and consumer prices. While in the last meeting, Chairman Powell made no statement indicating the overnight lending rate would stay flat, last month's meaningful headline inflation slowdown could lead to further stabilization in monetary policy in the coming months.
Lower business expenses aid logistics expansions. An 11.7 percent drop year-over-year in the index that tracks energy prices helped slow inflation. Not only do lower fuel costs provide some relief to consumers' wallets, they also reduce business operating expenses, including in the fields of transportation and warehousing. Lower energy costs may add momentum to an ongoing expansion by firms in these sectors. Over 456 million square feet of warehousing and distribution space was under construction as of May. In the same month, more than 24,000 logistics personnel were hired, triple the long-term average. These trends reflect the robust demand by consumers and other firms for logistics and warehousing services, keeping industrial property performance robust. U.S. industrial vacancy was at 4.0 percent in March, staying below pre-pandemic levels despite 20-year high stock growth.

Travel costs ease, aiding hotel performance. U.S. occupancy has been steadily improving since the early phase of the pandemic, and was up to 63.3 percent in April, not far below pre-2020 levels. Amid resilient hotel demand, the recent decline in transportation costs should boost leisure travel volumes near-term, supporting further occupancy improvement. Visitor counts to both drive-in and fly-to destinations stand to increase from double-digit drops in the prices for both gasoline and airfare recorded in May.
Homeownership barriers buoy multifamily demand. Despite recent cooling, inflation remains high, tempering household formation to a 28-month low in March. Elevated mortgage rates are, however, pushing single-family ownership costs ahead of multifamily renting, with the difference between the average apartment rent and monthly mortgage payment remaining above $1,000 in the first quarter. This underscores a need for apartments that will support property fundamentals long-term.
Retail vacancy still sparse amid headwinds. Food prices rose in May after holding in April, curbing purchasing power for lower-income households and moving many to spend less on non-necessity goods. Discretionary retail may face near-term headwinds as a result. Spending on furniture, sporting goods, electronics and apparel fell by more than 0.25 percent in April, resulting in price cuts in May. Retail vacancy nevertheless remained historically tight prior to these headwinds, at 4.7 percent in March. Mild construction in 2023 should keep the year-end rate well below the long-term mean of 5.9 percent.
Denver Office:
Adam Lewis Vice President, Regional Manager
Tel: (303) 328-2000 | adam.lewis@marcusmillichap.com
Prepared and Edited By:
Benjamin Kunde Research Analyst | Research Services
For Information on national multifamily trends, contact:
John Chang Senior Vice President, National Director | Research Services
Tel: (602) 707-9700 | john.chang@marcusmillichap.com
The information contained in this report was obtained from sources deemed to be reliable. Every effort was made to obtain accurate and complete information; however, no representation, warranty or guarantee, express or implied, may be made as to the accuracy or reliability of the information contained herein. Note: Metro-level employment growth is calculated based on the last month of the quarter/year. Sales data includes transactions sold for $1 million or greater unless otherwise noted. This is not intended to be a forecast of future events and this is not a guaranty regarding a future event. This is not intended to provide specific investment advice and should not be considered as investment advice. Sources: Marcus & Millichap Research Services; Bureau of Labor Statistics; CoStar Group, Inc.; Real Capital Analytics; RealPage, Inc. © Marcus & Millichap 2021 | www.MarcusMillichap.com