
National Report: Manufactured Home Communities 2H23
National Housing Shortage Necessitates Non-Traditional Residential Options; Leased Community Lots Gain Popularity
Manufactured home shipments to communities on the rise. In the first seven months of 2023, roughly 50,000 new manufactured homes were shipped. While this count was down year-over-year, strict zoning laws and other land-use preferences mean that fewer new manufactured home communities are being established, leaving these home buyers with limited rentable lot options outside of existing communities. In 2022, roughly 59 percent of all new manufactured homes were placed in a community or subdivision, a figure that increased by 80 basis points year-over-year. Around 36 percent of these new homes were put in a manufactured home community, where lots are leased, demonstrating a growing demand for rentable lot space. Nearly 112,900 manufactured homes were shipped in 2022, translating to over 40,600 homes placed on leased land. The increasing competition will keep the national lot vacancy rate low.
Population growth drives up single-family home costs. Metros with rapidly growing populations have noted compressing lot vacancy rates in manufactured home communities. The South and Mountain West regions are home to the five metros expected to grow the fastest in 2023. Dallas-Fort Worth, Houston, Phoenix, Atlanta and Austin each expect over 50,000 new residents this year. In the first half of 2023, all five markets noted lot vacancy below their trailing 10-year mean, and four were at least 200 basis points below that mark. This coincided with the median home price in each metro nearly doubling over the last decade. While manufactured homes have had similar upward pricing momentum, the absolute cost, at an average of just $127,000 in 2022, is still well-below that of the typical stick-built home.


Housing shortage spotlights manufactured home options. Freddie Mac estimates that the U.S. faces a housing shortage of roughly 3.8 million housing units, causing a re-evaluation of housing options beyond single- and multifamily homes. Manufactured homes have stood out for their lower production costs and quick assembly and, in 2022, they made up 10 percent of all housing starts. In June 2023, a new federal division, Office of Manufactured Housing Programs, was created to address inventory issues, recognizing the important role manufactured housing plays in the housing market. Updating housing regulations is a step in the direction of reducing current policy complications that come with zoning and production. This comes on top of Freddie Mac’s risk management assessment to potentially enter the personal property market and purchase those loan types. If this occurs, it would add liquidity to the personal property loan market, which includes the majority of manufactured homes
Age-restricted communities well-located for strong demand. As the baby boomer generation ages, demand for space in age-restricted communities has risen. Persistently high inflation over the last two years has eaten away at retirement savings faster than expected. In some cases, this has led to retirees rejoining the workforce or seeking out more affordable housing options. Age-restricted communities account for roughly one-third of the total U.S. inventory of community lots. The Southeast, Mountain and Pacific subregions are home to nearly all of these communities and account for 20 percent of the aged 55-plus cohort. Readily available affordable housing options could further inflate this segment of the population regionally
Vacancy
Manufactured home affordability keeps lot vacancy low. The national lot vacancy rate held below 6 percent through the end of 2022. Entering the second half of 2023, the majority of metros outside of the Midwest are on track to maintain this trend. In addition to manufactured homes being costly to move, it is estimated that only 43 communities have been constructed since 2010 due to zoning or other land-use preferences, shielding existing localities from major lot vacancy swings. The mean monthly mortgage payment on a single-family home has also crested 7 percent, due to the Federal Reserve’s series of interest rate hikes, and the heightened cost of homeownership further underpins demand for more affordable options.
Highlights:
• At the end of 2022, the Midwest was the only region that recorded lot vacancy over 6 percent as both the Great Lakes and Great Plains subregions had rates surpassing 10 percent. Among metros surveyed in the first half of the year, available space in many Michigan markets has remained elevated.
• The Pacific subregion recorded the lowest lot vacancy rate in the nation at the end of 2022. Tight rates logged in California markets were the primary contributors. Of the California metros surveyed in 2023 that were home to more than 8,000 homesites, Riverside-San Bernardino had the highest lot vacancy rate at just 3.2 percent.
• Among metros with more than 8,000 homesites surveyed through September, Flint, Detroit, Atlanta and Sussex had the highest lot vacancy rates. The top 10 lowest rates outside of California were located in Arizona, Colorado, Florida, Texas and Maryland.

Rent
Rent caps could be on the horizon in some states. Constrained supply additions, paired with rising demand, have facilitated record rent growth in recent years. At the end of 2022, the average lot rent was $646 per month. Several states have, however, taken action to cap rents in manufactured home communities. In June, the Delaware House of Representatives approved a proposal that would prohibit manufactured home community owners from increasing rent by more than 5 percent each year. This would replace a similar plan approved in the state last year that ties manufactured home rents to the consumer price index. Washington, Connecticut, Nevada and others have similar bills under review
Highlights:
• Due to tight vacancy rates in the Pacific, the subregion has consistently retained the highest average lot rent in the country. At $1,116 per month by the end of 2022, lots in this area were nearly twice the monthly average found in the Mountain West.
• Nearly all metros surveyed in the first half of 2023 logged rent increases. Out of all major U.S. markets, six of the top 10 greatest rent increases were located in Florida, highlighting the state’s growing demand for lower-cost housing. The Jersey Shore Area had the only double-digit rent gain outside of the South and West.
• Atlanta was the only market in the Southeast that logged a decreasing annual rent in 2023. Florida metros aided the subregion’s metric as rents rose on average across the state.

Sales
Deal flow hindered by first half interest rate hikes. In the first two quarters of 2023, the transaction velocity of manufactured home communities slowed relative to the same period in the last four years. The Federal Reserve’s series of interest rate hikes hindered lending markets and encouraged many buyers to take a wait-and-see stance. The end of the year could see renewed deal flow, however, as the Fed begins to take a more data-driven approach when considering additional rate hikes. The Federal Open Market Committee opted to hold the rate steady in September as parts of the economy show signs of softening, keeping the federal funds rate between 5.25 and 5.5 percent. This is still the highest level seen in 22 years.
Highlights:
• In the first two quarters, trades that took place were largely in lower price brackets, resulting in a lower average price per unit in the first half of 2023. The Mountain, Southeast and Great Plains subregions were the only areas to log mean price increases year-over-year. The national average price per unit did, however, stay above $70,000.
• The mean cap rate for manufactured home communities ticked up above 7 percent in the first months of 2023, following a lower rate in 2022. This metric is now back in line with historical measures. The East and West regions were the only areas below this mark.
• Transactions were most prevalent in the South and West. The Southeast witnessed the greatest number of trades, driven by manufactured home communities trading in Florida. The state’s growing population will likely aid sector fundamentals long-term.

Age-Restricted Communities
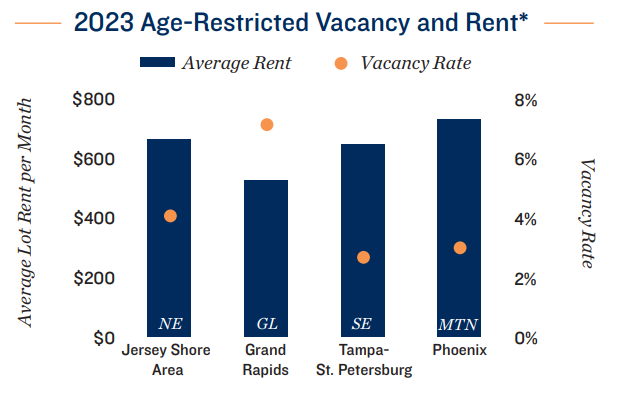
Growing older population fuels demand. During the last decade, the aged 55-plus cohort has grown by nearly 17 percent, compared to a 5 percent increase in total population. In 2022, the age bracket surpassed 100 million and is on-track to add 5.5 million residents through 2028. An aging cohort and subsequent demand for affordable seniors housing will allow lot vacancy in age-restricted manufactured home communities to be tight long-term. The five metros that expect the largest aged 55-plus population increases are all located in the Mountain West, the Gulf Coast and the Southeast. The Gulf Coast has one of the highest vacancy rates in these communities, which could be aided by the growing population in the long-run
Highlights:
• The Pacific subregion — home to the second-largest inventory of age-restricted manufactured housing — recorded the lowest lot vacancy rate in the U.S. at the end of last year. This corresponded to the highest average lot rent in the nation.
• The Northeast logged the second-lowest lot vacancy rate in the country. At the end of 2022, the subregion had a mean lot rent below the national average. Meanwhile, major Southeast metros, such as Orlando and Tampa-St. Petersburg, exhibited double-digit year-over-year rent growth in the first half of 2023.
• Areas with a generally lower cost-of-living, such as Midwest markets, typically have fewer age-restricted communities, higherthan-average lot vacancy rates and lower mean lot rents.
Denver Office:
Adam Lewis Vice President, Regional Manager
Tel: (303) 328-2000 | adam.lewis@marcusmillichap.com
Prepared and Edited By:
Benjamin Kunde Research Analyst | Research Services
For Information on national multifamily trends, contact:
John Chang Senior Vice President, National Director | Research Services
Tel: (602) 707-9700 | john.chang@marcusmillichap.com
The information contained in this report was obtained from sources deemed to be reliable. Every effort was made to obtain accurate and complete information; however, no representation, warranty or guarantee, express or implied, may be made as to the accuracy or reliability of the information contained herein. Note: Metro-level employment growth is calculated based on the last month of the quarter/year. Sales data includes transactions sold for $1 million or greater unless otherwise noted. This is not intended to be a forecast of future events and this is not a guaranty regarding a future event. This is not intended to provide specific investment advice and should not be considered as investment advice. Sources: Marcus & Millichap Research Services; Bureau of Labor Statistics; CoStar Group, Inc.; Real Capital Analytics; RealPage, Inc. © Marcus & Millichap 2021 | www.MarcusMillichap.com