
Multifamily National Report 3Q/22
Demand Momentum Eases After a Record Surge; Robust Fundamentals Sustain Sector
August 2022
Excerpt of Full Report:
Rental demand momentarily settles after an outstanding stretch. The multifamily sector entered 2022 in a historic position of strength. National vacancy was 120 basis points below any quarterly recording spanning 2000-2019, stimulating a competitive market among tenants, which accelerated rent growth. The average effective monthly rent in the U.S. rose nearly 16 percent in 2021, with annual jumps eclipsing 25 percent in several major Sun Belt markets. However, in the first half of 2022 — particularly in the second quarter — demand began to normalize as roughly 80,000 fewer households were created in the U.S. relative to the same six months of 2021. The cool down was prompted by economic headwinds, as well as inflationary impacts on household budgets, including adjusting for higher rent payments. Even with a slower second half, vacancy at midyear leaves ample leeway before rates in most metros approach pre-pandemic levels.
Top-performing markets in 2021 had the most notable inflections. Many of the locations that were standouts during the pandemic took a step back in the first half. After totaling more than 72,000 units of net absorption during the second half of last year, Atlanta, Dallas-Fort Worth, Houston, Las Vegas and Phoenix had a combined negative measure in the opening six months of 2022. The aggressive building pace in these markets is creating some near-term pockets of oversupply amid temporary demand slack, as some residents rebalance living costs after historic hikes. Nonetheless, migration patterns and thriving labor markets support elevated construction long term.
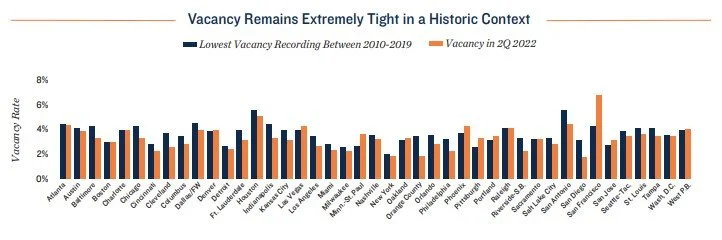
Sector outlook remains overwhelmingly positive. Despite the 60-basis-point rise in national apartment vacancy during the first half, approximately 20 percent fewer rentals were available at midyear across the U.S. compared to year-end 2019. These circumstances and steep barriers to homeownership support sustained momentum in the apartment sector, with the median price of a single-family home jumping by more than 30 percent over the past two years. More recently, mortgage rates have climbed to a post-Global Financial Crisis high. This is swelling the affordability gap, or the difference between an average monthly payment on a median priced home and an average rent obligation. The margin now exceeds $1,000 per month, about three times the magnitude of pre-pandemic norms, exemplifying the relational value of rentals. The cost-saving benefits, coupled with lifestyle elements, locational advantages and flexibility, will sustain apartment demand.
Cost-of-living preferences reflected in second quarter. Among the 140 U.S. metros with at least 25,000 units of local inventory, roughly 35 percent had positive net absorption during the second quarter. Of this grouping, almost half had an average effective rent below $1,400 per month, compared to a U.S. average of $1,735 per month. Smaller Southeast metros, like Huntsville, Knoxville and Augusta, are likely capturing population outflows from larger markets in the region. Comparatively affordable metros in the Midwest, such as Cincinnati, Des Moines, Madison and Omaha, also showed notable momentum.

Rentals Will Accommodate Excess Demand in the Coming Years

SINGLE-FAMILY HOUSING MARKET
Robust home buying in 2020 and 2021, when fi nancing was favorable and many households desired larger living spaces to accommodate at-home work and education, shrunk listing inventories in most metros. High demand amid low market supply caused prices to skyrocket, with the cost of an existing single-family home rising for 24 straight months through May 2022. The streak ended with a softening in June and July, but the median price held north of $390,000.
The volume of home purchases began to slow in the second quarter and is directly correlated to higher borrowing costs. The average 30-year fi xed-rate mortgage rapidly climbed into the mid-5 percent band during the fi rst half, after starting the year close to 3 percent. The Federal Reserve’s aggressive response to infl ation, including multiple interest rate hikes, catalyzed this surge. Additional Fed action in the coming months could sustain upward pressure on the cost and criteria to obtain a home mortgage.
A near-term price softening in the single-family sector is playing out, as more homes come to market and fewer prospective buyers pursue listings; however, current dynamics do not indicate a bursting bubble. The number of home listings nationwide in July remained nearly 35 percent shy of the same month’s average between 2015-2019. Low inventory will fortify the sector from a significant price collapse.
IMPLICATIONS FOR MULTIFAMILY
Historically elevated home costs, coupled with a period where mortgage rates are the highest they have been since the Global Financial Crisis, is creating pronounced challenges for first-time homebuyers. It is estimated that the minimum annual income needed to purchase a median-priced house is now well above $100,000, based on the standard Freddie Mac debt ratios. This is a benchmark that about three-fourths of U.S. households fall short of.
As the millennial cohort enters an age range typically aligned with household expansion, more of this generation will gravitate to the high-end rental market to meet their needs. A substantial share of millennials will rent longer than in previous generations, and Gen Z will likely do the same. An acquired fondness for lifestyle and cost-saving aspects of apartments is another potential outcome
Spillover demand from the single-family market to apartments is amplifying rental costs, while the sector was also playing catch up after a national rent decline of 0.8 percent in 2020. The average Class A and Class B effective rents in the U.S. grew by about 17.0 percent year over-year through June. The annual Class C gain was comparatively moderate at 12.3 percent. This variance stretched the rent gap within the quality spectrum, as Class C apartments are now roughly $400 per month less costly than Class B, compared to $290 one year ago.
Rent Growth and Housing Market Dynamics Will Keep Investors Active

2022 INVESTMENT OUTLOOK
Trading velocity starting to settle after a record-setting stretch. More apartment assets changed hands during the second half of 2021 than in any full calendar year prior to 2015. The entirety of 2021 featured the highest number of deals on record by almost 25 percent. Momentum carried into the early stages of this year, as the first quarter was the strongest January through March period in history. Activity finally started to pull back in the second quarter as interest rates started to rise, yet deal velocity remained above any equivalent three-month span prior to the onset of the pandemic.
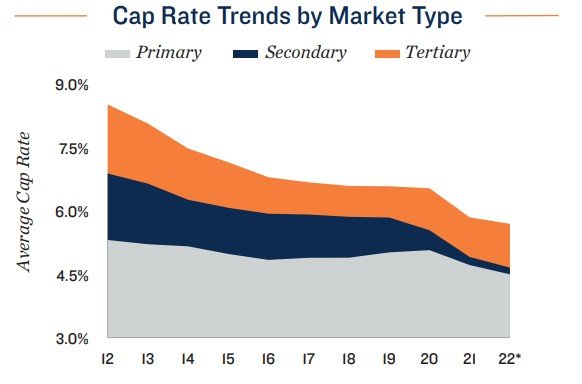
Rapid price growth and cap rate compression supported by performance. Stimulated by a competitive investment market amid record-breaking deal flow in recent quarters, the average price per unit climbed by about 15 percent during the 12-month period ended in June to $202,400. This annual gain was faster than any year from 2011-2021. As prices rose sharply, first-year returns contracted, reaching an average of 4.7 percent during the past year. This is down 60 basis points from the pre-pandemic measure in 2019.
Buyers return to primary markets as their recoveries gain steam. Many of the nation’s largest metros faced the most severe headwinds during the pandemic, suppressing the transaction market. The majority of these locations have turned the corner, however, encouraging investors to return. Primary metros accounted for roughly 44 percent of first half 2022 trades, compared to a 40 percent share during the same span of last year.

Economic Moderation and a Series of Interest Rate Hikes Influence Investment Market
Federal Reserve maintains aggressive fight against inflation, though the pace appears to be cooling. Through the first seven months of 2022, consistent month-over-month rises in headline CPI figures coaxed the Fed to lift the key policy rate by 225 basis points to a target range of 2.25 to 2.50 percent. Their combative action seems to have had an effect, as the most recent inflation measure in July showed a flat change from the previous month. At the same time, the July employment gain blew past estimates with the addition of 528,000 jobs, bringing the calendar year total to over 3 million new positions filled. This shows that the economy still has substantial muscle, despite two consecutive negative GDP releases. Nevertheless, statements from the Fed imply that it will continue with a series of planned rate hikes through year-end, with projections calling for two 50-basis-point increases and one 25-basis-point rise, to bring the target range to 3 percent to 4 percent by early 2023. Sustained job growth amid very low unemployment is providing the Federal Open Market Committee with the confidence to elevate borrowing costs, without derailing the economy. However, future risks remain apparent as supply chains continue to face headwinds and business investment has started to taper amid higher interest rates.
Strong property fundamentals and inflation-resistant qualities should help counterbalance transaction complications. Many lenders are recalibrating quoted rates and widening spreads, as monetary policy has quickly tightened. New CMBS securitization is being hindered by the rapid change in the benchmark policy rate, a challenge that is expected to persist through 2022. Balance sheet lenders, such as banks, are more insulated, but face their own set of challenges as they adjust lending criteria and objectives over time. Meanwhile, agency lenders are stepping up and providing the sector with stability and liquidity, as they have ample capacity to lend after using less than half of their annual cap through midyear. Many are providing competitive rates and terms, but are still playing it safe. It is possible that deal flow retreats in the near term amid these obstacles, which could lessen the downward pressure on cap rates as the market retreats from historic trading levels. Nonetheless, the asset classes’ very strong fundamentals and ability to turn over leases on a typical basis of 12 months, which is favorable during periods of high inflation, should bolster buyer interest.

Denver Office:
Adam Lewis Vice President, Regional Manager
Tel: (303) 328-2000 | adam.lewis@marcusmillichap.com
Prepared and Edited By:
Benjamin Kunde Research Analyst | Research Services
For Information on national multifamily trends, contact:
John Chang Senior Vice President, National Director | Research Services
Tel: (602) 707-9700 | john.chang@marcusmillichap.com
The information contained in this report was obtained from sources deemed to be reliable. Every effort was made to obtain accurate and complete information; however, no representation, warranty or guarantee, express or implied, may be made as to the accuracy or reliability of the information contained herein. Note: Metro-level employment growth is calculated based on the last month of the quarter/year. Sales data includes transactions sold for $1 million or greater unless otherwise noted. This is not intended to be a forecast of future events and this is not a guaranty regarding a future event. This is not intended to provide specific investment advice and should not be considered as investment advice. Sources: Marcus & Millichap Research Services; Bureau of Labor Statistics; CoStar Group, Inc.; Real Capital Analytics; RealPage, Inc. © Marcus & Millichap 2021 | www.MarcusMillichap.com