
Research Brief: Financial Markets November 2022
Fed Hikes Again, Complicating Trades of Otherwise Well-Performing Assets
November 2022
Excerpt of Full Report:
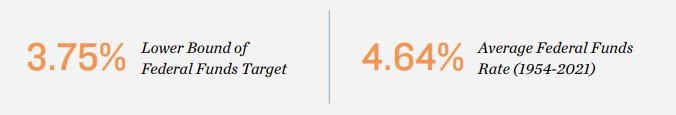
Federal Reserve lifts rates again, adjusts guidance. The Federal Open Market Committee implemented its sixth rate hike of the year on November 2, raising the federal funds rate by a fourth consecutive 75-basis-point margin. In fewer than eight months, the FOMC has taken the target range on the overnight rate from a lower bound of zero to an upper limit of 4.0 percent, the most rapid shift of interest rates since the 1980s. The Fed will continue to adjust rates up in the coming months, but the speed of these increases may slow. Language from the FOMC indicates they are closely monitoring the cumulative impact of their actions, understanding the full impact on the economy can take time to manifest. The Fed will want to see material evidence that inflation is trending back down toward the 2 percent target before the upward momentum on interest rates is abated, which leaves the door open in 2023 as to where rates will ultimately land.
Steadily climbing interest rates hold back markets from adapting. The shear magnitude and velocity of the interest rate changes over the past year have left financial and asset markets in a state of flux as investors play catch-up to the new environment. The strong performance of commercial real estate over the growth cycle that followed the Global Financial Crisis has produced substantial price appreciation, but also notable cap rate compression. These terms are no longer feasible in many cases, given notably higher financing costs. An expectations gap has formed as some investors adapt to the new conditions more rapidly than others, which is having an impact on investment sales.

Dynamic interest rate climate constraining transactions. The compounding effects of multiple interest rate hikes has made it more challenging to complete commercial real estate transactions. Preliminary figures for the third quarter show that across most major property types, trading activity has fallen below the same period last year, which was an atypically busy period across the board. In general, sales activity in recent months is short of, but close to the same quarter in 2019. Once interest rates stabilize at a new, higher plane, this consistency will help investors come to agreement and close deals more readily.
Additional Commercial Real Estate Implications
High cap rates highlight hotels. The challenges placed on investors by the Fed’s rapid tightening of monetary policy emphasizes properties with higher average cap rates. Hotels have changed hands over the past four quarters with first-year returns averaging in the low-8 percent zone, well above initial yields found in other property types. While financing premiums are also generally higher for hotels, improvements in property performance are helping to soften risk perceptions. National occupancy for the year ended in September was 62.2 percent, just 30 basis points below the long-term mean, while average daily rates for the month were up 17 percent from the same period in 2019.
Senior housing offers higher yields but nuanced outlook. Senior housing also has comparatively high yields. Cap rates on recent trades fall into the mid-7 percent range on average. While occupancies are generally improving, labor constraints and the rising operating costs are challenges, especially for smaller operations, which contribute to the higher yields, despite a growing need for care among the elderly.
Denver Office:
Adam Lewis Vice President, Regional Manager
Tel: (303) 328-2000 | adam.lewis@marcusmillichap.com
Prepared and Edited By:
Benjamin Kunde Research Analyst | Research Services
For Information on national multifamily trends, contact:
John Chang Senior Vice President, National Director | Research Services
Tel: (602) 707-9700 | john.chang@marcusmillichap.com
The information contained in this report was obtained from sources deemed to be reliable. Every effort was made to obtain accurate and complete information; however, no representation, warranty or guarantee, express or implied, may be made as to the accuracy or reliability of the information contained herein. Note: Metro-level employment growth is calculated based on the last month of the quarter/year. Sales data includes transactions sold for $1 million or greater unless otherwise noted. This is not intended to be a forecast of future events and this is not a guaranty regarding a future event. This is not intended to provide specific investment advice and should not be considered as investment advice. Sources: Marcus & Millichap Research Services; Bureau of Labor Statistics; CoStar Group, Inc.; Real Capital Analytics; RealPage, Inc. © Marcus & Millichap 2021 | www.MarcusMillichap.com